Tables - Select
This QScript can be used to easily select (remove) rows and columns from tables. Selection can be performed using check box controls in the Object Inspector or via page controls such as list boxes and combo boxes created via Anything > Page Design > Control.
Usage
- Select any tables on your page that you would like to select from (hold the Ctrl key when clicking on each table with the mouse to select more than one).
- Run the feature from the menu: Anything > Table > Select.
- If multiple tables are selected, you will be asked to provide names for them. Using these names, a combo box control will be added to your page, which allows for toggling between the table to be shown in the output.
- A single R Output will be added to your page containing the first selected table. Using the Object Inspector, uncheck any combo boxes for labels you do not want to show in the output table. Labels for data reductions such as NET and SUM are unchecked by default. Alternatively, you can supply a control or R Output containing labels to perform the selections.
- If necessary, you can add or remove tables using the controls in the Object Inspector. See the Inputs listed below.
Example
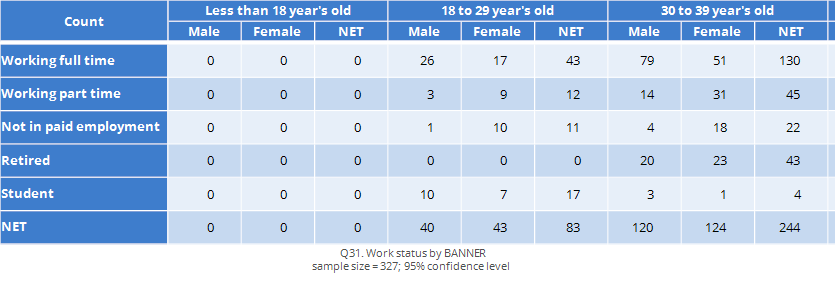
Consider the following table, a crosstab involving three Nominal variables showing work status by age and gender. Notice that the columns of the table contain a Banner.

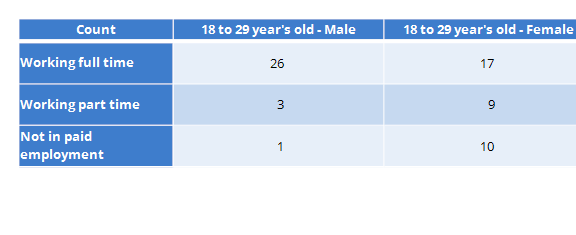
After running this script and unselecting the checkboxes for "Retired", "Student", "Less than 18 year's old", and "30 to 39 year's old" in the Object Inspector, we obtain the following output table.

Options
The options in the Object Inspector are organized into two tabs: Inputs and Properties.
Inputs
Each selected table is given its own group TABLE 1, TABLE 2, etc. which contain the GUI controls for selecting from the table. When a table is added to the last group, a new group will automatically be created so additional tables can be supplied. Each group contains the following controls.
Tables in page(s): The table to select from.
Select row(s) by: The method to use to select the rows of the table to include in the output, with the following options.
- Selecting options below - When this option is chosen, a checkbox control will appear for each label in the rows of the table. Uncheck the box beside a particular label to remove it from the output.
- Control or output from Page(s) - If this method is chosen, a drop-down Control to select row(s) appears, which can be used to supply an R Output or control containing the row labels to include.
- First rows - If this method is chosen, a numeric control Number of rows to select appears, which specifies the number of rows from the first to include; e.g., specify 3 to show only the first three rows of the table.
- Last rows - Similar to "First rows", except for selecting rows from the bottom of the table.
- Range - Use this option to specify a numeric range of indices to include. When selected, a text box Range appears for specifying the row numbers to include. Ranges are specified with a hyphen and multiple ranges can be separated by a comma; e.g., "2-5,8,12-15".
- First date-time periods - This method can we used when the row labels of the table contain dates to select for example the first 3 years of dates in the table or the first two quarters from the first date in the table. Three additional controls appear in this case: 1) Period specifies the date-time unit/period to consider, e.g. "Year", "Month", "Quarter", etc., 2) First date-time periods to select specifies the number of periods from the first date in the table to include, and 3) Calendar - If this is checked then the date-time periods selected will be relative to the calendar; e.g., the first quarter is always January - March. If unchecked, then date-time periods are counted relative to the first date in the table.
- Last date-time periods - Similar to "First date-time periods", except for selecting dates in relation to the last date in the table.
- Date range - If this option is selected, two controls appear Start date and End date, and only rows with dates falling between the chosen start and end dates will appear in the output table.
If there are columns in the table, then equivalent controls to above also appear for columns; e.g., Specify columns to select using, Number of columns to select, etc.
Additionally, when multiple tables have been added, the following GUI controls appear in a group TABLE SELECTION.
Table names: The names to use for the tables.
Toggle between tables using: A drop-down for supplying an output to use to toggle between the tables. The item names in the control should match Table names.
Properties
This tab contains options for formatting the size of the object, as well as the underlying R code used to create the output table, and the JavaScript code use to customize the Object Inspector itself (see Object Inspector for more details about these options). Additional options are available by editing the code.
How to apply this QScript
- Start typing the name of the QScript into the Search features and data box in the top right of the Q window.
- Click on the QScript when it appears in the QScripts and Rules section of the search results.
OR
- Select Automate > Browse Online Library.
- Select this QScript from the list.
Customizing the QScript
This QScript is written in JavaScript and can be customized by copying and modifying the JavaScript.
Customizing QScripts in Q4.11 and more recent versions
- Start typing the name of the QScript into the Search features and data box in the top right of the Q window.
- Hover your mouse over the QScript when it appears in the QScripts and Rules section of the search results.
- Press Edit a Copy (bottom-left corner of the preview).
- Modify the JavaScript (see QScripts for more detail on this).
- Either:
- Run the QScript, by pressing the blue triangle button.
- Save the QScript and run it at a later time, using Automate > Run QScript (Macro) from File.
Customizing QScripts in older versions
JavaScript
var __webpack_modules__ = ({});
// The module cache
var __webpack_module_cache__ = {};

// The require function
function __webpack_require__(moduleId) {

// Check if module is in cache
var cachedModule = __webpack_module_cache__[moduleId];
if (cachedModule !== undefined) {
return cachedModule.exports;
}
// Create a new module (and put it into the cache)
var module = (__webpack_module_cache__[moduleId] = {
exports: {}
});
// Execute the module function
__webpack_modules__[moduleId](module, module.exports, __webpack_require__);

// Return the exports of the module
return module.exports;

}

// webpack/runtime/rspack_version
(() => {
__webpack_require__.rv = () => ("1.7.2")
})();
// webpack/runtime/rspack_unique_id
(() => {
__webpack_require__.ruid = "bundler=rspack@1.7.2";
})();
includeWeb('Table Selection Functions');
selectFromTables(default_selection_mode = 'Typing labels to exclude');
See also
- QScript for more general information about QScripts.
- QScript Examples Library for other examples.
- Online JavaScript Libraries for the libraries of functions that can be used when writing QScripts.
- QScript Reference for information about how QScript can manipulate the different elements of a project.
- JavaScript for information about the JavaScript programming language.
- Table JavaScript and Plot JavaScript for tools for using JavaScript to modify the appearance of tables and charts.