Visualization - Exotic - Parallel Coordinates

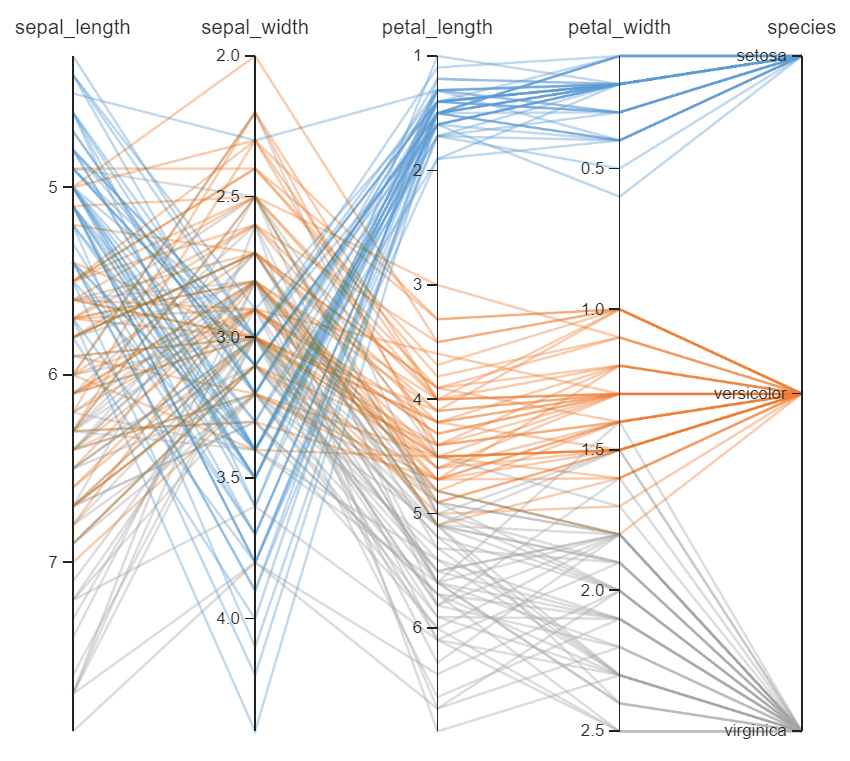
Parallel coordinates are a way to plot multivariate data. They are primarily used to visualize the relationships between many numeric variables. The chart gives each variable its own axis and positions it in parallel to the other axes, with the data points plotted as a series of lines along each axis.
Data format
The variable order of the parallel coordinates chart will determine how the axes are arranged. This is important to note because it is much easier to detect patterns between variables that are positioned adjacent to each other.
In Displayr, the axes are ordered exactly as the variables are ordered in the variables list. Re-ordering the axes in a meaningful way will make it easier to discover patterns and correlations.
Interpretation
A parallel coordinates chart can appear messy and cluttered. Here are some things to look for when interpreting the results.
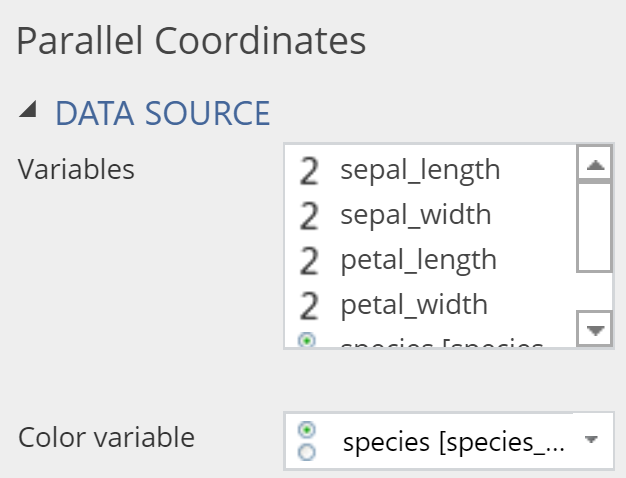
- Patterns between colored lines Setting the color variable (Inputs > DATA SOURCE > Color variable) will color-code each line according to the assigned variable. This allows you to more easily detect patterns and correlations.
- Clusters on a single axis Data points may be clustered around certain areas of an axis, which may be particularly noteworthy if the clusters are also differentiated by color on the chart.
- Patterns between axes Correlations between axes adjacent to each other indicate that the variables are in some way connected.
Example
The following example uses data the Iris flower data set, which measures certain characteristics of three species of Iris.
Create a Parallel Coordinates Chart in Displayr
- 1. Go to Insert > Visualization > Parallel Coordinates
- 2. Under Inputs > DATA SOURCE > Variables, Select the variables you want to include
- 3. Under Inputs > DATA SOURCE > Color variable, select the variable you want to color code.
- Tip: In step 3, select the variables in the order you wish to arrange the axes to prevent having to reorder it later.
Object Inspector Options
The following is an explanation of the options available in the Object Inspector for this specific visualization. Refer to Visualization Options for general chart formatting options.
Chart
- APPEARANCE
- Variables Variables to show in the chart. These must come from the same data set. Each variable will be shown on a separate axis.
- Color variable Optional variable used to color the lines in the chart. It must be a variable from the same data set as ::Variables, and can even be one of the variables included in Variables. If no variable is supplied, then all the lines in the chart will shown in the same color.
- Variable names Use variable names instead of variable labels to label axes of chart.
- Tidy labels Extract common prefixes from axes labels.
- Reverse axes Show smallest values at the top of the y-axes.
- Enable interactions When interactions are enabled users can click and drag on chart to select lines. However for large data sets it may be more efficient to turn off interactions.
- Render lines progressively Lines are gradually added to the chart, so the user can see when multiple overlapping lines are added.
- Line opacity Set transparency of lines to a numeric value between 0 (clear) to 1 (opaque). Note that overlapping lines of multiple colors will always be shown as a dark line (black hue).
- Line colors Select a color palette to use if Color variable is provided, or a single color if not.
- Rotate variable label Show variable labels at perpendicularly. This is useful for displaying longer labels. You may also need to adjust margin dimensions.
Acknowledgements
Uses the parcoords package by timelyportfolio.
Code
var __webpack_modules__ = ({});
// The module cache
var __webpack_module_cache__ = {};

// The require function
function __webpack_require__(moduleId) {

// Check if module is in cache
var cachedModule = __webpack_module_cache__[moduleId];
if (cachedModule !== undefined) {
return cachedModule.exports;
}
// Create a new module (and put it into the cache)
var module = (__webpack_module_cache__[moduleId] = {
exports: {}
});
// Execute the module function
__webpack_modules__[moduleId](module, module.exports, __webpack_require__);

// Return the exports of the module
return module.exports;

}

// webpack/runtime/rspack_version
(() => {
__webpack_require__.rv = () => ("1.7.2")
})();
// webpack/runtime/rspack_unique_id
(() => {
__webpack_require__.ruid = "bundler=rspack@1.7.2";
})();
var allow_control_groups = Q.fileFormatVersion() > 10.9;
var displayr = Q.isOnTheWeb();
function isEmpty(x) { return (x == undefined || x.getValue() == null && (x.getValues() == null || x.getValues().length == 0)); }
var template_prompt = "Create a template to control settings for all visualizations in the document by inserting 'Visualization > Template'";
font_families = !!Q.GetAvailableFontNames ? Q.GetAvailableFontNames() : ["Arial", "Arial Black", "Century Gothic", "Comic Sans MS",
    "Courier New", "Georgia", "Impact", "Open Sans", "Tahoma", "Times New Roman", "Trebuchet MS", "Verdana"];
palettes = ["Default or template settings", "Blues, light to dark", "Blues, dark to light", "Greys, light to dark", "Greys, dark to light", "Reds, light to dark", "Reds, dark to light", "Greens, light to dark", "Greens, dark to light", "Spectral colors (red, yellow, blue)", "Spectral colors (blue, yellow, red)", "Heat colors (yellow, red)", "Terrain colors (green, beige, grey)", "Custom gradient", "Custom palette"];

form.setHeading("Parallel Coordinates");
if (allow_control_groups)
    form.group("Data Source");
form.dropBox({ label: "Variables", name: "formVariables", multi: true, min_inputs: 2, max_inputs: 20, required: true, types: ["Variable"], prompt: "Choose variables to show in chart" });
var colVar = form.dropBox({ label: "Color variable", name: "formColorVar", multi: false, required: false, types: ["Variable"], prompt: "Choose a variable (from the same data set) which will be used to color the observations in the chart" }).getValue();
form.checkBox({ label: "Variable names", name: "formNames", default_value: false, prompt: "Show variable names instead of variable labels" });
form.checkBox({ label: "Tidy labels", name: "formTidyLabels", default_value: true, prompt: "Extract common prefixes to simplify labels" });
form.checkBox({ label: "Reverse axes", name: "formReverseAxes", default_value: true, prompt: "Show smallest values at the top of the chart" });

form.checkBox({ name: "formInteractive", label: "Enable interactions", prompt: "Lines can be selected by clicking on chart and dragging", default_value: true });
var queueOpt = form.checkBox({ name: "formQueue", label: "Render lines progressively", default_value: false }).getValue();
if (queueOpt)
    form.numericUpDown({ name: "formQueueRate", label: "Lines per frame", minimum: 1, default_value: 10, maximum: 200, prompt: "Increase number to speed up rendering of lines" });

if (allow_control_groups)
    form.page("Chart");
var qTemplate = form.dropBox({ name: "formTemplate", label: "Use template", types: ["RItem:AppearanceTemplate"], required: false, prompt: template_prompt });
var use_default_fonts = !isEmpty(qTemplate);

if (allow_control_groups)
    form.group("Colors");
form.numericUpDown({ label: "Line opacity", name: "formOpacity", default_value: 0.4, minimum: 0, maximum: 1.0, increment: 0.05 });
if (colVar == null)
    form.colorPicker({ label: "Line color", name: "formColor", default_value: "#5C9AD3" });
else {
    var qColor = form.comboBox({ name: "formPalette", label: "Line colors", alternatives: palettes, default_value: palettes[0], required: true });
    var colOpt = qColor.getValue();
    if (colOpt == "Custom gradient") {
        if (!allow_control_groups)
            var qGradientLabel = form.newLabel("Gradient start/end");
        form.colorPicker({ name: "formCustomGradientStart", label: !allow_control_groups ? "" : "Gradient start", default_value: "#5C9AD3" });
        form.colorPicker({ name: "formCustomGradientEnd", label: !allow_control_groups ? "" : "Gradient end", default_value: "#ED7D31" });
    }
    if (colOpt == "Custom palette")
        form.textBox({ name: "formCustomPalette", label: "Custom palette", default_value: "#5C9AD3, #ED7D31", prompt: "Enter color as a string. Multiple values should be separated by commas." });
}
if (allow_control_groups)
    form.group("FONT");
var qGlobalFontFamily = "Open Sans";
var qGlobalFontColor = "#444444";
var qGlobalFontUnit = "pt";
use_default_fonts = form.checkBox({ name: "formGlobalFontDefault", label: "Use default or template font settings", default_value: use_default_fonts, prompt: template_prompt }).getValue();
if (!use_default_fonts) {
    qGlobalFontFamily = form.comboBox({ name: "formGlobalFontFamily", label: "Global font family", alternatives: font_families, default_value: "Open Sans", editable: true, prompt: "Select the font to use. You can also type the name of a font directly (including custom fonts)." }).getValue();
    qGlobalFontColor = form.colorPicker({ name: "formGlobalFontColor", label: "Global font color", default_value: "#444444" }).getValue();
    qGlobalFontUnit = form.comboBox({ name: "formFontUnits", label: "Font units", default_value: "pt", alternatives: ["px", "pt"], prompt: "Specify font sizes in pt or px" }).getValue();
}
if (allow_control_groups)
    form.group("Variable labels");
form.checkBox({ name: "formVarLabRotate", label: "Rotate variable label", default_value: false });
var varlabels_default_fonts = form.checkBox({ name: "formVarLabDefault", label: "Use default or template font settings (for 'Values axis title')", default_value: use_default_fonts, prompt: template_prompt }).getValue();
if (!varlabels_default_fonts) {
    form.comboBox({ name: "formVarLabFontFamily", label: "Variable label font family", alternatives: font_families, default_value: qGlobalFontFamily, editable: true, prompt: "Select the font to use. You can also type the name of a font directly (including custom fonts)." });
    form.colorPicker({ name: "formVarLabFontColor", label: "Variable label font color", default_value: qGlobalFontColor });
    form.numericUpDown({ name: "formVarLabFontSize", label: "Variable label font size", default_value: 10, increment: 0.5, prompt: "Font size in " + qGlobalFontUnit });
}

if (allow_control_groups)
    form.group("Values axis tick labels");
var ticklabels_default_fonts = form.checkBox({ name: "formTickLabFontDefault", label: "Use default or template font settings", default_value: use_default_fonts, prompt: template_prompt }).getValue();
if (!ticklabels_default_fonts) {
    form.comboBox({ name: "formTickLabFontFamily", label: "Tick label font family", alternatives: font_families, default_value: qGlobalFontFamily, editable: true, prompt: "Select the font to use. You can also type the name of a font directly (including custom fonts)." });
    form.colorPicker({ name: "formTickLabFontColor", label: "Tick label font color", default_value: qGlobalFontColor });
    form.numericUpDown({ name: "formTickLabFontSize", label: "Tick label font size", default_value: 9, increment: 0.5, prompt: "Font size in " + qGlobalFontUnit });
}

if (allow_control_groups)
    form.group("MARGINS");
form.numericUpDown({ name: "formMarginRight", label: "Right margin", maximum: 1000, default_value: 0 });
form.numericUpDown({ name: "formMarginLeft", label: "Left margin", maximum: 1000, default_value: 0 });
form.numericUpDown({ name: "formMarginTop", label: "Top margin", maximum: 1000, default_value: 40 });
form.numericUpDown({ name: "formMarginBottom", label: "Bottom margin", maximum: 1000, default_value: 0 });
library(flipFormat)
library(flipChartBasics)
library(flipStandardCharts)
data <- as.data.frame(formVariables, check.names = FALSE)
names(data) <- if (!isTRUE(get0("formNames"))) Labels(formVariables) else Names(formVariables)
if (formTidyLabels)
    names(data) <- flipFormat::ExtractCommonPrefix(names(data))$shortened.labels
group <- get0("formColorVar")
unfiltered.data = data
if (length(QFilter) > 1)
{
    data <- data[QFilter,,drop = FALSE]
    if (!is.null(group))
        group <- group[QFilter]
}

is.all.missing.before.filtering <- apply(unfiltered.data, 2, function(x) all(is.na(x)))
if (sum(is.all.missing.before.filtering) == 1) {
    StopForUserError("The variable '", Labels(formVariables)[is.all.missing.before.filtering],
                     "' does not have any non-missing data.")
} else if (sum(is.all.missing.before.filtering) > 1) {
    StopForUserError("The variables '", paste0(paste0("'", Labels(formVariables)[is.all.missing.before.filtering], collapse = ","), "'"),
                     "' do not have any non-missing data.")
}

is.all.missing <- apply(data, 2, function(x) all(is.na(x)))
if (sum(is.all.missing) == 1) {
    StopForUserError("The variable '", Labels(formVariables)[is.all.missing],
                     "' does not have any non-missing data after filtering.")
} else if (sum(is.all.missing) > 1) {
    StopForUserError("The variables '", paste0(paste0("'", Labels(formVariables)[is.all.missing], collapse = ","), "'"),
                     "' do not have any non-missing data after filtering.")
}

if (!is.null(group)) {
    is.group.all.missing <- all(is.na(group))
    if (is.group.all.missing) {
        if (all(is.na(get0("formColorVar")))) {
            StopForUserError("The color variable does not have any non-missing data.")
        } else {
            StopForUserError("The color variable does not have any non-missing data after filtering.")
        }
    }
}

template <- get0("formTemplate")
if (!is.null(template) && !is.null(group))
    template$brand.colors <- GetBrandColors(template, as.data.frame(group), QFilter, "Scatter", 1)

if (is.null(template))
{
    default.font <- QAppearance$Font$Family
    default.color <- "#444444"
    template <- list(
        global.font = list(family = default.font, color = default.color, size = 8, units = "pt"),
        fonts = list(
            `Values axis title` = list(family = default.font, color = default.color, size = 10),
            `Values axis tick labels` = list(family = default.font, color = default.color, size = 9)),
        colors = QSettings$ColorPalette)
}

colors <- get0("formColor")
if (is.null(colors))
    colors <- ChartColors(min(length(unique(formColorVar)), 10),
                given.colors = GetPalette(formPalette, template),
                custom.color = NULL,
                custom.gradient.start = formCustomGradientStart,
                custom.gradient.end = formCustomGradientEnd,
                custom.palette = formCustomPalette, silent = TRUE)


viz <- ParallelCoordinates(data, group = group,
    colors = unique(colors),
    reverse.axes = formReverseAxes,
    opacity = formOpacity,
    global.font.family = get0("formGlobalFontFamily", ifnotfound = template$global.font$family),
    global.font.color = get0("formGlobalFontColor", ifnotfound = template$global.font$color),
    label.font.family = get0("formVarLabFontFamily", ifnotfound = template$font$`Values axis title`$family),
    label.font.color = get0("formVarLabFontColor", ifnotfound = template$font$`Values axis title`$color),
    label.font.size = get0("formVarLabFontSize", ifnotfound = template$font$`Values axis title`$size),
    label.rotate = formVarLabRotate,
    tick.font.family = get0("formTickLabFontFamily", ifnotfound = template$font$`Values axis tick labels`$family),
    tick.font.color = get0("formTickLabFontColor", ifnotfound = template$font$`Values axis tick labels`$color),
    tick.font.size = get0("formTickLabFontSize", ifnotfound = template$font$`Values axis tick labels`$size),
    margin.top = formMarginTop,
    margin.bottom = formMarginBottom,
    margin.left = formMarginLeft,
    margin.right = formMarginRight,
    width = 72 * QOutputSizeWidth - 40,
    height = 72 * QOutputSizeHeight - 40,
    interactive = formInteractive,
    queue = formQueue,
    queue.rate = get0("formQueueRate"),
    font.unit = get0("formFontUnits", ifnotfound = template$global.font$units)
)

