This rule rule re-arranges a table which has a Banner selected in the Brown Drop-down Menu so that the spans from the banner appear in the rows instead of the columns. This rule requires that the banner selected in the Brown Drop-down Menu has a single pair of questions that are stacked on top of one another.
Example
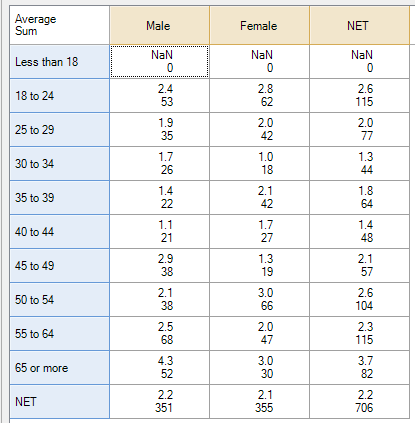
The following table shows a Number question in the Blue Drop-down Menu and a nested Banner in the Brown Drop-down Menu. Sometimes it is useful to reshape the data by 'stacking' by one of the questions in the banner, to reorganize the table so that is appears like the lower table.

Note that due to the nature of the changes, this resulting table will not behave like a normal Q table. For example, you cannot drag-and-drop to rearrange rows and the NET categories will appear when you export.
Technical details
This rule does not apply when a Pick One - Multi, Pick Any - Grid, Number - Grid, Ranking, or Experiment question is selected in the Blue Drop-down Menu.
Statistics - Right and Statistics - Below are not available on a table that uses this rule.
Some statistics no longer make sense once the table has been rearranged and are not available. These statistics are:
- % Column Share
- % Row Share
- % Share
- % Total Responses
- % Column Responses
- % Row Responses
- Index
Significance testing results are not available once the table has been rearranged.
How to apply this rule
For the first time in a project
- Select the table(s)/chart(s) that you wish to apply the rule to.
- Start typing the name of the Rule into the Search features and data box in the top right of the Q window.
- Click on the Rule when it appears in the QScripts and Rules section of the search results.
OR
- Select Automate > Browse Online Library.
- Choose this rule from the list.
Additional applications of the rule
- Select a table or chart that has the rule and any table(s)/chart(s) that you wish to apply the rule to.
- Click on the Rules tab (bottom-left of the table/chart).
- Select the rule that you wish to apply.
- Click on the Apply drop-down and choose your desired option.
- Check New items to have it automatically applied to new items that you create. Use Edit > Project Options > Save as Template to create a new project template that automatically uses this rule.
Removing the rule
- Select the table(s)/chart(s) that you wish to remove the rule from.
- Press the Rules tab (bottom-right corner).
- Press Apply next to the rule you wish to remove and choose the appropriate option.
How to modify the rule
- Click on the Rules tab (bottom-left of the table/chart).
- Select the rule that you wish to modify.
- Click Edit Rule and make the desired changes. Alternatively, you can use the JavaScript below to make your own rule (see Customizing Rules).
JavaScript
▶ Show Code
includeWeb('Table JavaScript Utility Functions');
includeWeb('QScript Utility Functions');

excludeRTables();
table.requireNumericTable();
table.requireOriginalRowsColumns();
let rule_name = "Unnest a nested banner table";
form.setSummary(rule_name);
form.setHeading("Unnest a Nested Banner Table");
let description = form.newLabel("Restructure the table so that column spans are shown as separate rows.");

// Prevent Statistics - Right and Statistics - Below
const is_displayr = inDisplayr();
const marginal_separator = is_displayr ? ">" : "-";
const right_message = "Statistics " + marginal_separator + " Right are not available for this table. "
        + "Remove any selections from the Statistics " + marginal_separator + " Right menu";
const below_message = "Statistics " + marginal_separator + " Below are not available for this table. "
        + "Remove any selections from the Statistics " + marginal_separator + " Below menu";
if (is_displayr) {
    if (rightTableExists() && right_table.statistics.length > 0)
        form.ruleNotApplicable(right_message);
    if (belowTableExists() && below_table.statistics.length > 0)
        form.ruleNotApplicable(below_message);
}
if (!is_displayr)
{
    suppressOutputForRightTable(right_message);
    suppressOutputForBelowTable(below_message);
}

// Check structure of table is appropriate
if (!questionInTableIs1D(table.blue))
	form.ruleNotApplicable('the question in the blue drop-down is a Pick One - Multi, Pick Any - Grid, or Number - Grid');

if (questionInTableIs1D(table.blue) && table.brown == "SUMMARY")
    form.ruleNotApplicable('this table does not have any column spans');

if (table.columnSpans.length == 0)
	form.ruleNotApplicable('this table does not have any column spans');

if (table.availableStatistics.indexOf("Coefficient") > 0)
	form.ruleNotApplicable('the question in the blue drop-down is an Experiment or Ranking')

let checkbox_footer = form.newCheckBox('footer', 'Show significance testing message in footer');
checkbox_footer.setDefault(true);
form.setInputControls([checkbox_footer]);
let add_footer = checkbox_footer.getValue();

preventAllSignificanceTesting(table, rule_name, add_footer);

// Detect Span Structure
let spans = table.columnSpans;
// Check whether the first span has a different length to subsequent spans
// If the length of the span is different then it indicates that the first span contains
// the other spans in the table.
let span_tidied = (spans[0].indices.length == spans[spans.length-1].indices.length);

let num_spans;
if (span_tidied)
	num_spans = spans.length;
else
	num_spans = (spans.length - 1)/2;

let new_num_cols = spans[0].indices.length;

if (!(table.numberColumns-1 == num_spans*new_num_cols || table.numberColumns == num_spans*new_num_cols))
   form.ruleNotApplicable(correctTerminology('this banner does not have a single pair of questions stacked on top of one another'));

// Get Row and Column labels
let new_col_labels = table.columnLabels.slice(0, new_num_cols);
let cur_row_labels = table.rowLabels;
let new_row_labels = [];

if (span_tidied)
	for (let j = 0; j < spans.length; j++)
		new_row_labels.push(spans[j].label);
else
	for (let j = num_spans; j < 2*num_spans; j++)
		new_row_labels.push(spans[j].label);

// Build the new table
// Remove the final NET column
if (table.numberColumns > num_spans*new_num_cols)
table.deleteColumn(table.numberColumns-1);

// Figure out the size of the new table
let cur_num_rows = table.numberRows;
let new_num_rows = cur_num_rows*num_spans;

// Get the stats
let stats_array = [];
for (let j = 0; j < table.statistics.length; j++)
	stats_array.push(table.get(table.statistics[j]));

// Reshape the table
while (table.numberColumns > new_num_cols)
	table.deleteColumn(table.numberColumns-1);

while (table.numberRows < new_num_rows)
	table.insertRowAfter(table.numberRows-1, "");

// Determine the row labels and spans
if (cur_num_rows == 1) {
	table.rowLabels = new_row_labels;
} else {
	for (let j = 0; j < num_spans; j++) {
		let span_array = [];
		for (let k = j*cur_num_rows; k < (j+1)*cur_num_rows; k++)
			span_array.push(k);
		table.spanRows(span_array, new_row_labels[j]);
	}
	let repeated_row_labels = [];
	for (let j = 0; j < num_spans; j++)
		for (let k = 0; k < cur_num_rows; k++)
			repeated_row_labels.push(cur_row_labels[k]);
    table.rowLabels = repeated_row_labels;
}

// Reshape the statistics and set them to the table
for (let j = 0; j < stats_array.length; j++) {
	let dummy_stat = table.get(table.statistics[0]);
	let stat = stats_array[j];
	for (let row = 0; row < table.numberRows; row++) {
		for (let col = 0; col < table.numberColumns; col++) {
			let r = row%cur_num_rows;
			let chunk = Math.floor(row/cur_num_rows);
			dummy_stat[row][col] = stat[r][chunk*table.numberColumns + col];
		}
	}
	table.set(table.statistics[j], dummy_stat);
}

// Clear results that don't make sense or which are wrong
let forbidden_stats = ["% Column Share", "% Row Share", "% Share", "% Total Responses", "% Column Responses", "% Row Responses", "Index"];
forbidden_stats.forEach(function(stat) {
	if (table.availableStatistics.indexOf(stat) > 0)
		setStatisticToNaN(stat);
});

// Tidy the resulting table
table.clearColumnSpans();

// Returns true if the specified question is one-dimensional
function questionInTableIs1D(question_name) {
	let temp_table = calculateTable(question_name, "SUMMARY", ['!UseQFilters'], '!UseQWeight');
	return !temp_table.columnLabels;
}


// Replace all statistic values in the named statistic with NaN (or blanks for statistics that have string values)
function setStatisticToNaN(statistic_name) {
	let nan_stat = table.get(statistic_name);
	let num_rows = table.numberRows;
	let num_cols = table.numberColumns;
	let nan_value;
	if (isTextStatistic(statistic_name))
		nan_value = "";
	else
		nan_value = NaN;
	for (let row = 0; row < num_rows; row++)
		for (let col = 0; col < num_cols; col++)
			nan_stat[row][col] = nan_value;
	table.set(statistic_name, nan_stat);
}
See also

