TURF - Upset Plot
Creates an upset plot, showing the intersection between binary variables. It is useful for understanding the results of a TURF analysis. Our TURF eBook contains more information on how to interpret and use this visualization.
Example
Usage
In Displayr, go to Insert > More > TURF > Upset plot.
In Q, go to Automate > Browse Online Library > TURF > Upset plot.
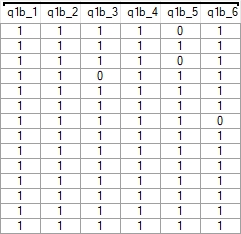
To run this function, the data must consist of more than one variable in a binary format (1's and 0's), where the 1's represent selected values and 0's represent options that were not selected. It should look like the following in your raw data:
Variable sets or questions that contain binary data are represented with an icon of either two or four check-boxes.
In the object inspector on the right of the screen, under Inputs > Alternatives select one or more binary variable sets (questions), change any other settings as required.
Options
Binary variables Two or more binary variables or a question of binary variables.
COLOR > Column color The color of the columns showing the size of the intersections.
COLOR > Dot color The color of dots that appear below the columns.
COLOR > Background shade The color of the shading behind the dots.
COLOR > Bar color The color of bars showing the size of each of the alternatives (selected values of the binary variables).
Acknowledgements
Uses the UpsetR package.
Code
var __webpack_modules__ = ({});
// The module cache
var __webpack_module_cache__ = {};

// The require function
function __webpack_require__(moduleId) {

// Check if module is in cache
var cachedModule = __webpack_module_cache__[moduleId];
if (cachedModule !== undefined) {
return cachedModule.exports;
}
// Create a new module (and put it into the cache)
var module = (__webpack_module_cache__[moduleId] = {
exports: {}
});
// Execute the module function
__webpack_modules__[moduleId](module, module.exports, __webpack_require__);

// Return the exports of the module
return module.exports;

}

// webpack/runtime/rspack_version
(() => {
__webpack_require__.rv = () => ("1.7.2")
})();
// webpack/runtime/rspack_unique_id
(() => {
__webpack_require__.ruid = "bundler=rspack@1.7.2";
})();
var heading_text = "Upset Plot";
if (!!form.setObjectInspectorTitle)
    form.setObjectInspectorTitle(heading_text);
else
    form.setHeading(heading_text);


form.dropBox({ name: "formData",
    label: "Binary variables",
    types: ["Q: pickany, pickanycompact, pickanygrid",
        "V: numeric, categorical, ordered categorical"],
    multi: true,
    required: true });
form.group("COLOR");
form.colorPicker({ name: "formMainBarColor",
    label: "Column color",
    default_value: "#3e7dcc" });
form.colorPicker({ name: "formMatrixColor",
    label: "Dot color",
    default_value: "#3e7dcc" });
form.colorPicker({ name: "formShadeColor",
    label: "Background shade",
    default_value: "#8cc0ff" });
form.colorPicker({ name: "formSetsBarColor",
    label: "Bar color",
    default_value: "#8cc0ff" });
x <- list()
for (nm in names(formData))
{
    elem <- formData[[nm]]
    if (is.data.frame(elem))
    {
        for (nm2 in setdiff(names(elem), c("NET", "SUM")))
            x[[nm2]] <- elem[[nm2]]
    }
    else
        x[[nm]] <- elem
}
x = as.data.frame(x, check.names = FALSE)
if (NCOL(x) <= 1)
    StopForUserError("A minimum of 2 variables is required to create an upset plot.")
x = x[QFilter, ]
levels = suppressWarnings(as.character(unique(unlist(lapply(x, unique)))))
if (any(!complete.cases(x)))
    StopForUserError("Data contains missing values. This is not possible for Upset plots. Please either recode them or filter the plot.")
if (!all(levels %in% as.character(0:1))) {
    types = if (get0("productName") == "Q") "Set the Question Type of the variables to Pick Any or Pick Any - Grid."
        else "Set the structure of the variable sets to Binary - Multi or Binary - Grid."
    StopForUserError("Upset plots require binary variables. ", types)}
if (!is.null(QPopulationWeight))
    StopForUserError("A weight has been applied. This is not possible for Upset plots.")
UpSetR::upset(x,
      keep.order = TRUE,
      nsets = ncol(x),
      order.by = "freq",
      mainbar.y.label = "Intersection size",
      set_size.numbers_size = 6,
      color = "orange",
      matrix.color = formMatrixColor,
      main.bar.color = formMainBarColor,
      shade.color = formShadeColor,
      shade.alpha = 0.1,
      sets.bar.color = formSetsBarColor,
      sets.x.label = "Number of observations",
      text.scale = 1.5)
