Text Analysis - Advanced - Map
Creates a 2 dimensional map visualizing the tokens in a Text Analysis output based on their frequency patterns. The area of the markers are proportional the number of respondents which used the token, whereas the position is determined by the selected dimension-reduction method (e.g t-SNE, PCA, MDS).
This function requires that an existing Text Analysis - Advanced - Setup Text Analysis object.
Example
In Displayr, go to Insert > Text Analysis > Advanced > Map.
In Q, go to Create > Text Analysis > Advanced > Map
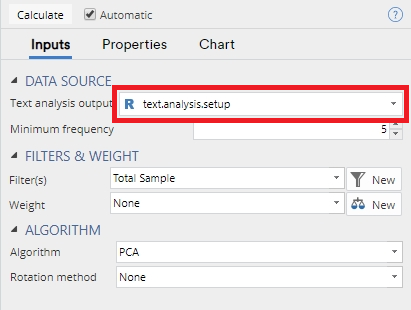
- Under Inputs > DATA SOURCE > Text analysis output select a Text Analysis - Advanced - Setup Text Analysis object.
- Change any Chart and other settings you like.
- Ensure the Automatic box is checked, or click Calculate
The output generated by this function will provide a bubble plot, like this:
Options
Text analysis output Input data for this analysis. It can be created using Text Analysis - Setup Text Analysis.
Algorithm The dimension reduction method used to group and position the tokens. Details about parameters controlling the algorithm can be found in Dimension Reduction - Principal Components Analysis and Dimension Reduction - t-SNE.
Minimum frequency Threshold number of times a token must occur before being included in the analysis.
Label font family Font family of labels in scatterplot.
Label font size Font size of labels in scatterplot.
Maximum number of labels Specify the number of points showing labels. To avoid too many labels making the chart unreadable, the rest of the labels can be seen by hovering over the points.
Marker opacity Opacity of the markers ranging from 0 (transparent) to 1 (opaque).
Maximum marker diameter This controls how the size of the markers will be scaled.
Code
var allow_control_groups = Q.fileFormatVersion() > 10.9; // Group controls for Displayr and later versions of Q
var controls = [];
var heading_text = "Map Text Analysis Tokens";
if (!!form.setObjectInspectorTitle)
    form.setObjectInspectorTitle(heading_text, heading_text);
else
    form.setHeading(heading_text);
font_families = !!Q.GetAvailableFontNames ? Q.GetAvailableFontNames() : ["Arial", "Arial Black", "Comic Sans MS",  "Courier New", "Georgia", "Impact",
                 "Open Sans", "Tahoma", "Times New Roman", "Trebuchet MS", "Verdana"];

form.group("Data Source");
var input = form.dropBox({label: "Text analysis output", name: "formInput", types:["RItem: wordBag, categorizedlist"], required: true,
                               prompt: "Tokens and word-frequencies will be taken from the Text Analysis output"});
controls.push(input)
var mfreq = form.numericUpDown({label: "Minimum frequency", name: "formMinFreq", default_value: 5, minimum: 1, maximum: Number.MAX_SAFE_INTEGER,
                                prompt: "Tokens which occur at frequencies below this will be omitted from the analysis"});
controls.push(mfreq);

form.group("Algorithm");
var algo_type = form.comboBox({label: "Algorithm", alternatives: ["PCA", "t-SNE", "MDS - Metric", "MDS - Non-metric"], name: "formAlgorithm", default_value: "PCA", prompt: "The method for performing the dimensionality reduction"});
controls.push(algo_type);

if (algo_type.getValue() == "PCA")
{
     var rotation_type = form.comboBox({ name: "rotationType",
                                        label: "Rotation method",
                                        alternatives: ["None",
                                                     "Varimax",
                                                     "Quartimax",
                                                     "Equamax",
                                                     "Promax",
                                                     "Oblimin"],
                                        default_value: "None", prompt: "Varimax, Quartimax and Equamax produce uncorrelated components"});
    controls.push(rotation_type);
    if (rotation_type.getValue() == "Oblimin")
        controls.push(form.numericUpDown({name: "delta", label: "Delta", default_value: 0, increment: 0.1, maximum:0.8, minimum: -100,
                            prompt: "Oblimin control parameter"}));
    if (rotation_type.getValue() == "Promax")
        controls.push(form.numericUpDown({name: "kappa", label: "Kappa", default_value: 4, increment: 1, minimum: 2, maximum: Number.MAX_SAFE_INTEGER,
                            prompt: "Promax control parameter"}));

    var print_type = form.comboBox({ name: "printType", label: "Output", alternatives: ["Loadings Table", "Structure Matrix", "Variance Explained", "Component Plot", "Scree Plot", "Detailed Output", "2D Scatterplot"], default_value: "Loadings Table", prompt: "Output to be shown" });
}
if (algo_type.getValue() == "t-SNE")
{
    var perplex = form.numericUpDown({name: "formPerplexity", label: "Perplexity", default_value: 5, increment: 1, maximum: 100, minimum: 2,
                                      prompt: "Low values emphasize local rather than global structure"});
    controls.push(perplex);
}
if (allow_control_groups)
    form.page("Chart");
controls.push(form.comboBox({label:"Label font family", name: "formLabelFontFamily", alternatives: font_families, default_value: "Open Sans", editable: true, prompt: "Select the font to use. You can also type the name of a font directly (including custom fonts)."}));
controls.push(form.numericUpDown({label: "Label font size", name: "formLabelFontSize", default_value: 10}));
controls.push(form.numericUpDown({label: "Maximum number of labels", name: "formMaxLabels", default_value: 50, maximum: 99}));
controls.push(form.numericUpDown({label: "Marker opacity", name: "formMarkerOpacity", default_value: 0.2, minimum: 0, maximum: 1, increment: 0.05}));
controls.push(form.numericUpDown({label: "Maximum marker diameter", name: "formMarkerDiameter", default_value: 100, minimum: 1, maximum: 1000}));
form.setInputControls(controls);
library(flipTextAnalysis)
map <- MapTokens (formInput,
    algorithm = formAlgorithm,
    min.freq = formMinFreq,
    # Parameters for tSNE
    perplexity = get0("formPerplexity", ifnotfound = 0),
    # Parameters for PCA
    rotation = get0("rotationType"),
    eigen.min = get0("eigenMin"),
    n.factors = 2,
    promax.kappa = get0("kappa"),
    oblimin.delta = get0("delta"),
    # Charting parameters
    labels.font.family = formLabelFontFamily,
    labels.font.size = formLabelFontSize,
    max.labels = formMaxLabels,
    max.diameter = formMarkerDiameter,
    opacity = formMarkerOpacity)
